In this series, RTA Instructor Lee Doucet shares what students are learning in their training, what data projects they're participating in, and what data curiosities they might have uncovered in their journey with rel8ed.to. Let's check in to see what students were up to last week...
The Final Week
As the final class of the RTA came to an end, it was a very bittersweet moment for me as an instructor. It has been exciting watching all my students grow as they cross the finish line and hand in their assignments. Then there is the difficult part--the goodbyes and the energy in the classroom that is missing in my routine since the students departed two weeks ago.
It was quite the journey. We trekked the gambit of data research investigation techniques, data analysis, coding with Python, and even competitive trivia where Ariana Zastrow walked away with a cool $100 dollars courtesy of President Bob Lytle.
I received many great projects over the 5-week training academy – it's almost hard to believe some of the work was produced by our students, such as high school students Ariana, Andrew, and Misbah.
In this final post, I'd like to share a glimpse into one of the student projects from Jad-ElAssi, an undergraduate student at the University of McMaster. Jad performed exceptional work with us at the RTA this summer. One of our focuses was encouraging students to be curious about the data that informs our world -- Jad took this spirit and began his own investigation into the Olympics.
During his exploratory data analysis, Jad realized that women had received far fewer total medals overall than men. Picking this apart and using Tableau, Jad was able to graph medals over time to notice that the total medals was trending towards equality as we moved closer to the present day. Using the data as a jumping point, Jad realized he needed more information outside of the data to fully understand the picture of what was going on. This is the process we taught at the RTA this summer: be curious, use your tools to investigate, and keep asking more questions in this iterative process.
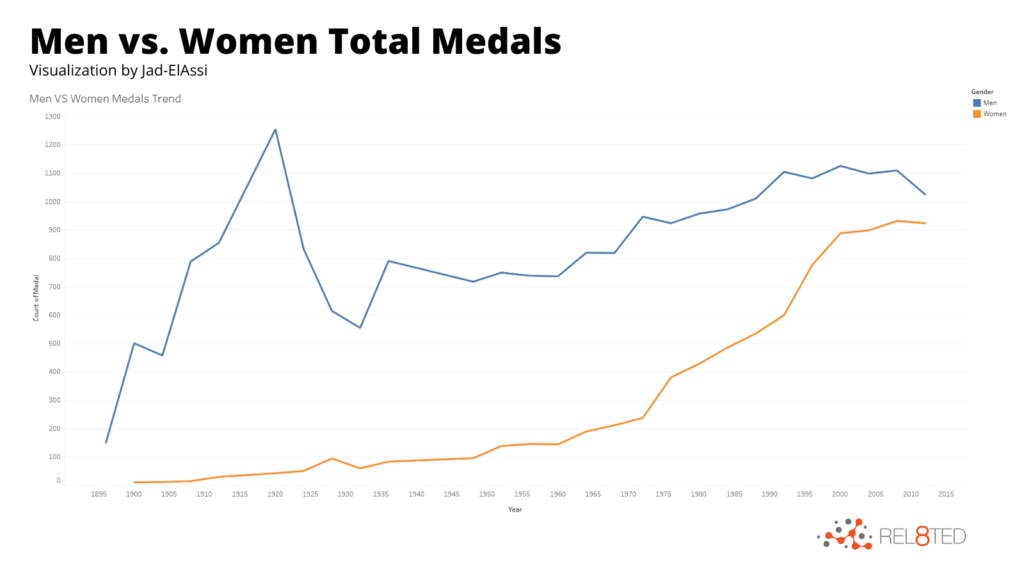
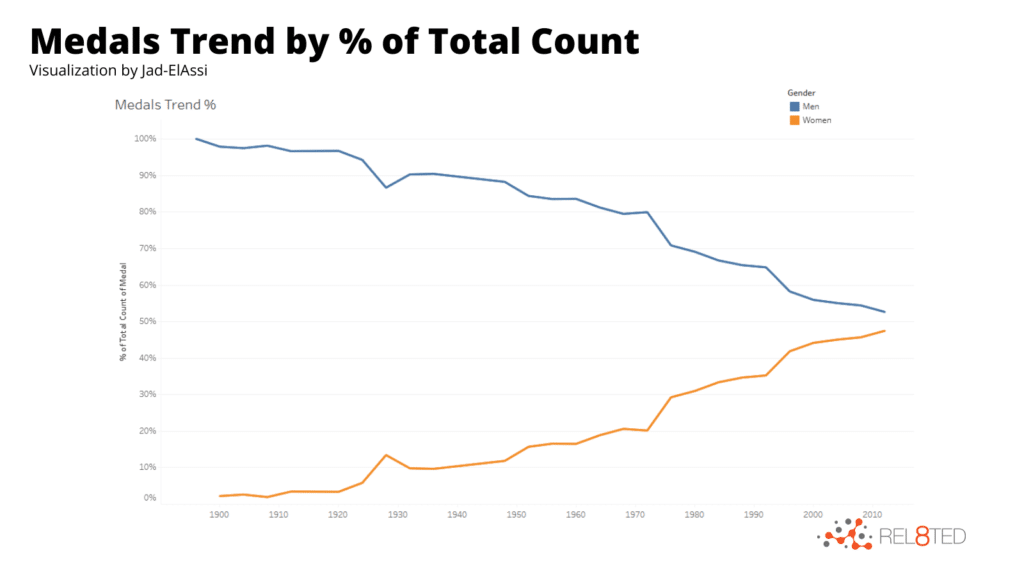
To summarize Jad’s words regarding his findings: “We can see in the data that men had more medals in sports such as Athletics, Wrestling, Boxing, and Weightlifting (because women were also not permitted to participate for many, many years--the 2000s for weightlifting, for instance!). However, women closed the gap through Aquatics medals... We can also see the gap between the medals won throughout the years closing to just ≈100 medal difference (2012), with a huge jump in 1968-1976 and the introduction of the civil rights law, 'Title IX' that states:
"No person in the United States shall, on the basis of sex, be excluded from participation in, be denied the benefits of, or be subjected to discrimination under any education program or activity receiving Federal financial assistance is likely the main driver of this improvement.”
There you have it, a quick data project that has delivered an insight. Not only did Jad earn a Micro-credential for his effort, he learnt a valuable set of skills that will help him in his future data projects. rel8ed.to Analytics will be watching his progress and his cohorts' very closely as rising data stars.
PS. We're continuing the Robot Training Academy this fall! Interested in joining? Find out more HERE.
Week 5 & 6
As the RTA moves towards the end of its 5-week pilot project, students are building on the lessons learnt from previous workshops to put out impressive work.
Even more impressive is the time required from lesson to work output. With only 20 minutes of instruction, students were able to use the tool Tabula and easily scrape data from an online publication. They are also at the level where our company President Bob Lytle can come in, showcase a project that needs to be complete, and hand off components to the team with a tight deadline.
Our series of guest speakers concluded with a bang – University of Toronto’s alumni Faria Khandaker joined the class to showcase the python library Pandas. Expanding on the knowledge that our Data Analyst Song provided to the class earlier, Faria provided a deep dive into the data set Bicycle Counts from the Toronto Open Data Portal. The data shows movements of cyclists at various intersections and multi-use trails within Toronto – which can be used to promote the public good by assisting city planners and organizations build cases for more support for bicycles.
This practical workshop demonstrated how there are valuable data sets in our public websites that can be readily used to help promote civic issues. Students were also exposed to how data is organized within a data set and to extract information from it. Being able to tell how many bicycles were traveling Westbound in a particular morning can help us understand the needs of citizens.
Stay tuned next week – when we'll be showcasing student projects!
Week 4: Basic Coding
Last week started off with a bang – we finally got to coding.
Our very own Data Analyst, Song, introduced the RTA to the basics of coding through Python, one of the most popular computer programming languages. Core concepts ranged from writing/reading files, if/else conditions, lists/dictionaries, and for/while loops. These fundamentals provided the skills required for the more advanced Python courses: Data Processing with Pandas & Python Applications.
Several of our students flew through the workshop -- apparently we have a lot of aspiring coders in our training series!
Later in the week we had a guest speaker from the University of Toronto, Steven Kinnunen, who is a graduate student studying Human Values of Data Science. Steven introduced students to a Python project that he worked on that came with a very valuable lesson – sometimes projects do not work out the way you had intended. More importantly, that is perfectly okay and acceptable. This was placed in the context of the pressure placed on individuals working with data to determine the meaning and significance of it. One solution often used to accomplish this is to just plug in more data to help turn the search light onto any possible relationship. Spending too much time trying to determine any plausible relationship in the data is known as data dredging, a common pitfall which distracts researchers and statisticians from reporting what the data actually tells them. A very important lesson all of us should consider – especially if we want to improve our data literacy.
Finally, the week ended with advanced classification work as students worked with OpenRefine.
Our students can now perform several tasks with multiple phases in different programs. Getting data from Metabase on a particular sector, students can now upload that data to OpenRefine where they can sort and organize sectors for rejection keywords. Basically, what keywords don’t belong in a particular sector and forming a rule around it. This project was hot off the presses with a looming deadline. With only an hour of training, students were already contributing valuable work to our Data Analyst, Sam Briosius, who is leading the classification part of our work project.
And that's a wrap for week 4 -- looking forward to a long weekend and web scraping in the week ahead!

Week 3: Training Robots
Our students at the RTA had a big week as they began working on projects that encompassed several different software platforms. Most exciting for us at rel8ed.to Analytics was that they finally got the opportunity to train robots this week!
Using our proprietary software that classifies websites, the students worked on data sets to build a training model for our AI software to better classify webpages. Best comment of the workshop goes to Jad for asking, “what do I do if the website is in Russian?”
Later in the week we moved towards our Data Quality workshop which was a deep dive into the inner workings of what makes data appropriate for usage and common problems associated with data. Focusing on critical reflection, we wanted students to think about the assumptions that they make about data and how even the simplest assumptions can be misleading.
For instance, if we had a column of data with each row having a date inputted, we do not know for certain that those are classified as numbers for the purposes of arithmetic. They could be a string, which are just characters that can’t be added or subtracted and this would be a problem if you were expecting to be able to perform mathematical operations on the numbers.
Another concern with dates is that many countries input the order of day, month, and year differently. If you saw data that was listed as 14/6/2008 and your format was month/day/year, it would not be difficult to find that error and correct it. However, what if the data was still in the wrong format of day/month/year and showed 4/4/2008, how would you know there was a problem? This is why data quality is so important and why organizations need to be aware of these challenges when working with data.
We finished the week strong with our own CEO Bob Lytle teaching the much-anticipated Data Visualization class. Students were introduced to Tableau Public and explored open data that they had found on data portals.
For our Data Visualization workshop, students used Andrew’s Ontario School Demographic data to explore Tableau. This data set shows 2019 academic scores and socio-economic indicators for all Ontario schools. By visualizing schools on a map, students had the chance to tangibly touch the data and manipulate it. Learning about how to explore data this way is preparing us to take the next steps with our own data sets and move beyond just the collection phase.
We are building towards our RTA capstone of completing a data project and presenting the findings. Stay tuned!
Week 2: Data Understanding
The Robot Training Academy has completed its first workshop series, Data Understanding, and has moved onto the next one, Advanced Data Understanding.
With new workshops being offered, students are learning about taxonomy through industry standard classification. More specifically, students are coming up with rules that categorize companies as one type of classification (e.g. "trucking company") while eliminating them from consideration from another type of classification (e.g. "farming company")?
Not long after starting work on these classification projects, students got to observe firsthand the types of problems that routinely come up within an analytics company.
Students searching for farms noticed that the system was flagging companies as farming because they were located in a geographic area called Farmville. Now, as one student suggested, couldn’t you just remove Farmville from showing up? Now, that would solve one problem, but as the student learnt, it creates other problems that need to be solved. Removing that one keyword helps, but what about the farms that are in Farmville? The only way to tackle this problem is to come up with rules to solve it, for instance, just being in Farmville is not enough to be tagged, it needs another keyword to have them placed into the system.
These types of problems are part of the creative process of solving complex data problems. They are the same type of work our data and research analysts solve on a daily basis.
To help the students understand the importance of the work, they were visited later in the week by Craig Simpson from IDC, who gave some personal insight into why accurate classification is so important to the type of work that they do.
With that, students were let go early as rel8ed.to Analytics prepares this week to teach them about data quality and website tagging. A robot's work is never done!
Week 1: The 411 on all things Data
The students at the Robot Training Academy have completed their first week and it’s been a huge success.
We kicked off the week learning investigation techniques with Data Analyst Samantha Brosius. Then students jumped into learning about Business Analyst Andres Avila’s work extracting, cleaning, and presenting data as a business case.
After only an hour of lectures, students were already working with large data sets and successfully transforming them. Even more amazing is this data work is exactly what Andres Avila does for rel8ed.to Analytics professionally -- it looks like we may have some replacements for Andres when he leaves to return full time for his masters in the fall 😉
When students are not working on data projects, they are networking with industry professionals to build confidence and learn how their new skills are applicable in the job market.
This week, after a workshop on data privacy and compliance, students had the opportunity to talk to guest speaker William Trefiak, a Cybersecurity and Privacy Associate at PwC Canada. Students were eager to connect directly with an industry professional working on topics that they had just learnt about.
In this open Q&A, William was kind enough to open up the floor for students to ask him any an all questions about his journey to PwC, the life of a consultant, and the current privacy landscape. William reinforced what students had just learnt in their workshops about GDPR in the EU, CCPA in California, and changes happening in Canada around data privacy and compliance.
And before parting, William left us with some touching advice after RTA student Misbah asked what he would tell his younger self. Without skipping a beat, William said, “Go easy on yourself, life is going to be okay. Oh, and try and enjoy life as much as possible before you start to work.”
A great message for our students and a great way to end the week. (Although the instructor pondered if that advice could be taken as quit the RTA program to enjoy the summer outdoors. Hopefully not!)
This post was written by Lee Doucet.