This week we check in with Sam Brosius, rel8ed.to Stats Hero and champion horse-trainer in her spare time. Real-world data science always requires testing and challenging output - and sometimes begs for a layered solution to deliver the best outcome.
When preparing data files for client projects, there are multiple steps that we take in order to ensure that we are sending out clean and reliable information. As much as we wish we get it right the first time out, that's rarely the case.
Design a System
One of the first systems I built at rel8ed.to identifies and flags geographical outliers in geocoded data. Why did we need this? Well, given the large number of data sources underlying our Advanced Business Database, we've learned to check everything. Sometimes, get some really interesting results, even from official sources. Like this: a public datasource of US companies with some surprising locations...
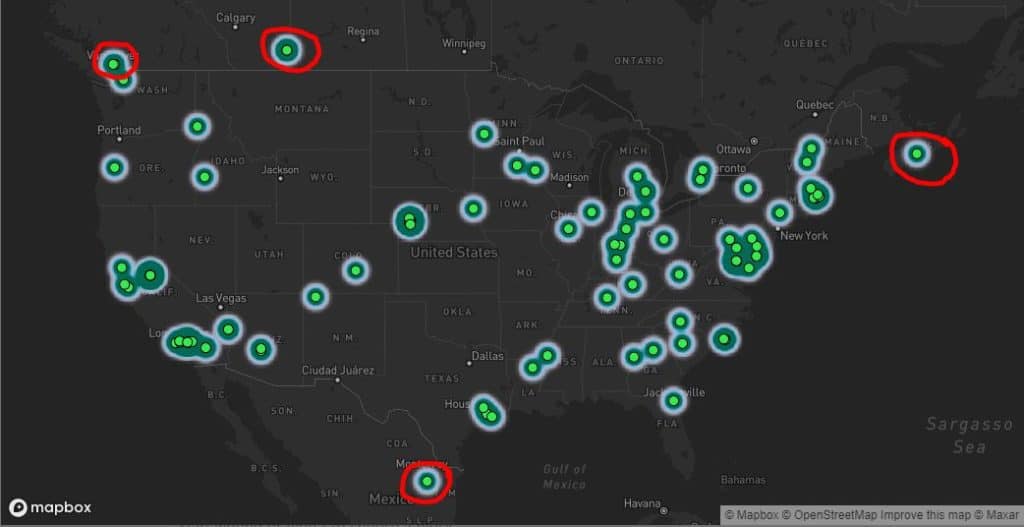
In statistics, an outlier is a piece of data that differs significantly from the overall set of data points. We are often interested in identifying outliers because they can point to important sources of error in data collection. For example, outliers can indicate improper data entry or an incorrect assumption about how our data are distributed. In our case, the identification of outliers may point to incorrectly geolocated data. This becomes particularly important if the client decides to use mapping software to run visual analysis on the data.
Identify Outliers: the Z-Score
All outliers are candidates for removal from the dataset for further quality checks. And we certainly don't want to deliver this data to the client when we have doubt. And yet: we're working with millions of new records every week and can't possibly inspect everything by hand. This begs for an automated solution.
The process of outlier identification I used in the early stages of the system used a Z-Score, a standardized method to identify distance from the average values in a dataset. Approximately 99.7% of data points will generally fall within ±3 standard deviations (or distances from) the average value of the set. When a data point reflects a Z-score that falls outside of these bounds, we identify it as an outlier. I used this statistical concept to identify geographical outliers based on specific region locations in North America.
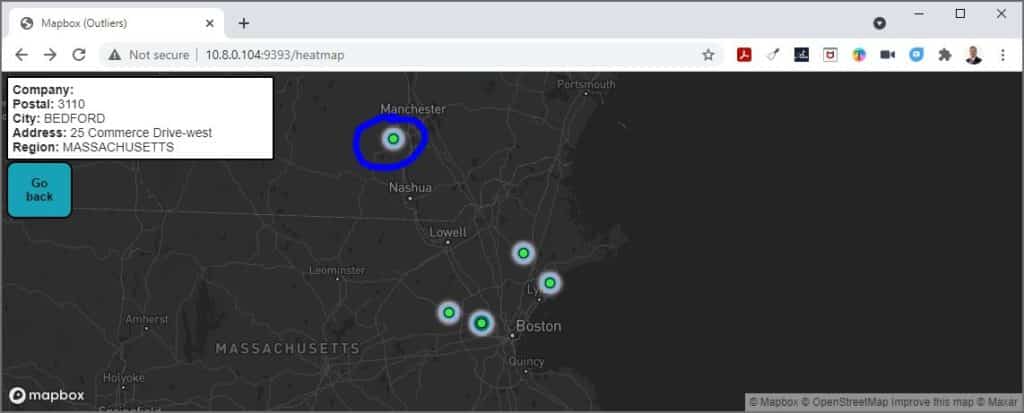
It turns out that the method of Z-Score outlier identification has certain limitations. The Z-Score method is not effective at identifying outliers when we are working with datasets that contain fewer observations (this method will not work when we have n<12 observations). When working with less populated regions that contain only a few data points, we may run into an issue where outliers are not identified at all.
Stack the Solution
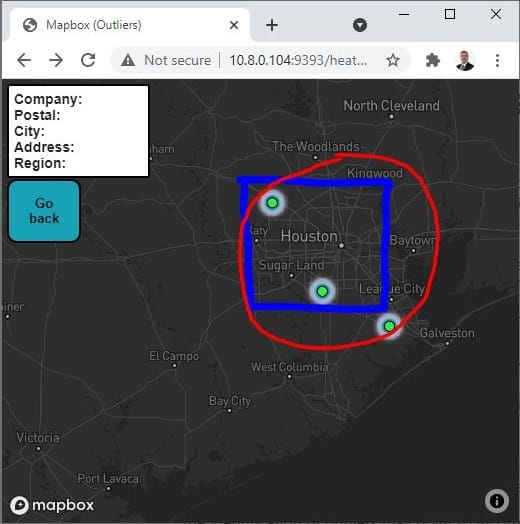
To account for this small-n limitation in our calculation, we devised a more robust process. Working off regional geographic boundaries rather than just using the data points themselves helped us obtain two layers of outlier information. We combined these two processes and can now output a file that identifies any outliers marked by either process.
We now have the ability to make informed decisions about whether a data point has a bad address or geolocation before putting that data to the client - enhancing our product and reducing rework in the process. Our client gets better geocoded data - and our data team gathers valuable information to tune our gathering process for higher upstream quality.
Live and Learn
Takeaways from a project like this: always check your data for quality indicators that can point to a broader problem to address. And, constantly challenge your solutions to see if they should still stand, should improve, or sometimes should be thrown away. Never stop learning!
This post was written by Sam Brosius.