In this series, Robot Training Academy Instructor Vega Yu shares what students are learning in their training, what data projects they're participating in, and what data curiosities they might have uncovered in their journey with rel8ed.to. Let's check in to see what students have been up to...
Week 5 - 7
This week we started work on advanced projects with Python.
Our Data Analyst, Song Zhai, introduced the RTA to the basics of coding through Python, one of the most popular computer programming languages.
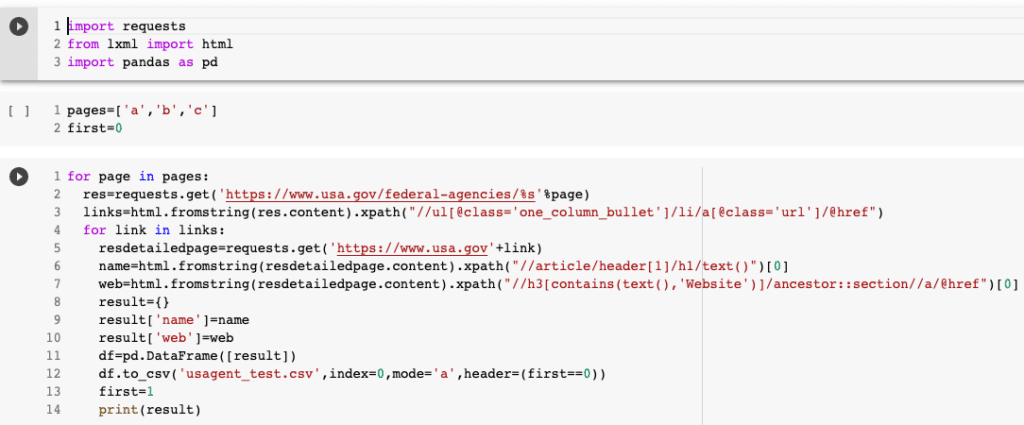
Core concepts ranged from writing/reading files, if/else conditions, lists/dictionaries, and for/while loops. Song demonstrated one of his previous working projects using Python for web scraping.
It was exciting for the students to see how much useful data could be returned after running specific code. Song expanded on coding knowledge by sharing his working experience and advice -- sometimes outputs do not work out the way you had intended and you'll have to do some trial and error. The code may need to be modified based on different structures of websites. After sufficient practice, you’ll find the pattern that works for the data needed. It’s also important to utilize different tools to obtain the information we want. Song showed how to use his preferred tools including Pandas, Python and Xpath for his scraping work.
Our RTA students engaged positively through the workshop, showing interest in more Python applications. Some students even applied their skills their weekly assignments and gained great results. They're looking forward to the advanced projects in the week ahead!
In the following week, we had a guest speaker from CIBC, Jim Yang, who is a graduate student studying in Business Analytics. Jim introduced his daily work routine as a risk analyst, including reporting portfolio performance and monitoring, data quality management and data governance and documentation. Jim also shared his insightful thoughts about application of software like SAS and SQL. After a short presentation, students were able to get a better understanding of the bank industry and how data can be applied in a specific business function. What inspired students most is that Jim had a similar academic background as them, and they were glad to have the chance to connect with an industry professional and expand their network.
Stay tuned next week - when we'll be showcasing students more projects!
******
Week 3 - 4
We kicked off week 3 learning how to manage databases with Data Analysts Rahul and Mohit who gave an introduction on data types and different tools to manage data. Then students jumped into learning about investigation techniques with Business Analyst Andres Avila. Andres shared his work on a real business project, showing how to extract, clean, and present data for a final deliverable.
After only an hour of presentations on investigating data, students were able to quickly learn how to work with large data sets and use techniques to transform them. Andres also assigned some parts of his project to provide hands-on experience for students. When students are not studying, they are gaining experience working on real businesses cases and learning how to leverage their new skills in the job market.
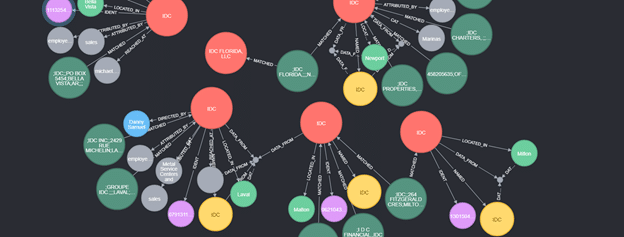
During week 4, we took the class a little deeper into the topic of using techniques to find data. To illustrate how to find and use data for a real business project, Vega raised a hypothetical case where a client wanted to find data records for specific industry research. Most of this data is available through online public website resources, but how could the students gather this data and translate it into a valuable deliverable to the client? Vega introduced her work on screening data information from the integrated website and using web scraping tools like Xpath to extract data. She also shared her data finding process using neo4j. From building a graph database to filtering the data with specific queries, students learned each working step in her project.
The students have been doing a great job on their assignments, and we're proud of the huge progress they've made in applying data analysis techniques to real projects!
******
Week 2: What is data science?
This week we held our second class for the RTA Winter 2022 cohort. Vega led the class through a workshop explaining data science in broad strokes to help students understand the applications of data science in the real business world.
We loved hearing stories from students about their own work experience in a specific field in data science, e.g. marketing analysis, consulting, and approaches to using data in their daily life. We also talked about how data science can apply to almost any industry and how it has many uses beyond its typical association with tech industries.
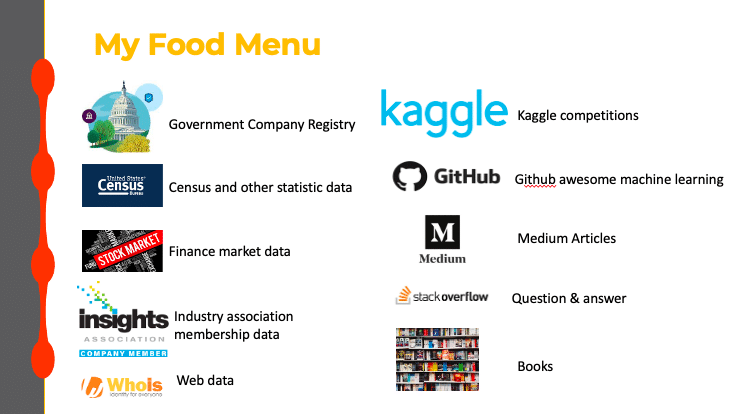
In the second half of our live workshop, Analytics Lead at rel8ed.to, Zack Dai, presented “One day as a data scientist at rel8ed.to” to our students. Zack began with illustrating specific fields where data analytics can be applied and gave an overview of various tools he uses including web scraping, visualization, and coding. Zack walked students through a typical day at work -- and 6 key aspects of what he does as a data scientist daily.
1.Data environment -- "we swim in the graph every day."
Zack described his daily work in a data environment with some great literary flair. In Zack's words, “As a data scientist you need to live in the data, breathe in information, and walk in the cloud. At rel8ed.to, we swim in the graph every day.”
2. Collaborating with other departments
To help our clients and account managers solve their problems, Zack has to first start by patiently listening to colleagues and their needs. Then Zack gets to work building a process and map of how internal systems will work together to deliver what clients needs. Starting with “Web front-> backend-> API server->database ->client GUI system," Zack uses this step-by-step process to develop delivers, monitor progress, and diagnose any potential problems. After identifying any concerns, it is essential to follow-up with notes and fixed schedule for system updates.
3. Useful data analytics tools
Zack not only showcased how to use tools such as Tableau, neo4j, Kumiho, and Google Analytics, he also explained to students how to choose specific tools for specific projects. For example, rel8ed.to's Kumiho system is a machine learning software that is based on company categorization. Users can investigate company websites and learn more about specific categories of companies through Kumiho's capabilities.
4. Think for the client
In his work with clients, Zack notes how important it is to treat a client as one of your colleagues -- ask questions, anticipate needs, and learn more about their situation so you can help solve their problems. Zack raised the example of a client who might ask for help finding companies in the US who are doing "finance outsourcing." To support this, we'd have to provide a solution based on keywords (finance outsourcing), gather data from our internal database, but also obtain more data to ensure a complete picture. He'd then build a keyword-based scoring system, adding weighting for customized ranking and additional data attributes to help sort more valuable leads from less valuable leads.
5. Learn from teaching
Teaching is also an important part of Zack's like -- and an important step to becoming a data professional. For Zack, learning by teaching is a very efficient learning style. Teaching can help build a good team environment; because you cannot finish everything on your own, training others can also help you in return. If you can build a good workshop, it means you have mastered the skills and have been able to share this with others. Working in both business and academic environments can also foster innovation and new ideas.
6. Keep studying
Finally, Zack encourages students to keep learning. Zack told students he was not from a technical background, but with his hard studying, he became more and more interested in the field. After daily work, he kept exploring data with various tools and learning new skills. Zack also indicated continuous learning was a must for analytics and IT careers, but just learning technology was not enough, staying on top of industry trends and domain knowledge was also very important.
******
Week 1: Intro of RTA
The students at the Robot Training Academy of Winter 2022 have completed their first week and it’s been a huge success!
We're thrilled to be working with brilliant participants from the University of Rochester, Brock University, and Buffalo State. Some students are majoring in data analytics and eager to connect with industry projects. Others are wanting to build up their resume with more hands-on experience.
After the introducing the RTA, we kicked off our workshop series with a project for an industry partner. This partner is a customs broker company providing comprehensive customs and logistics services. The students were assigned to learn more about the partner's background, collect information regarding their market, customer needs, and projected growth of the company in their marketplace. Based on this information, we asked students to think about how this partner could find a new market and location for expanding the business.
We started with this project to give students a glimpse into the life of a data consultant in the business world. Stay tuned for what we'll be working on in the following weeks!